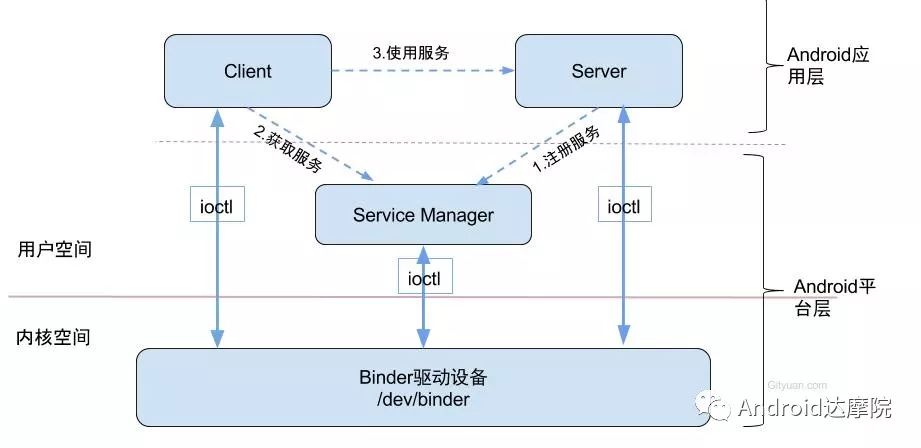
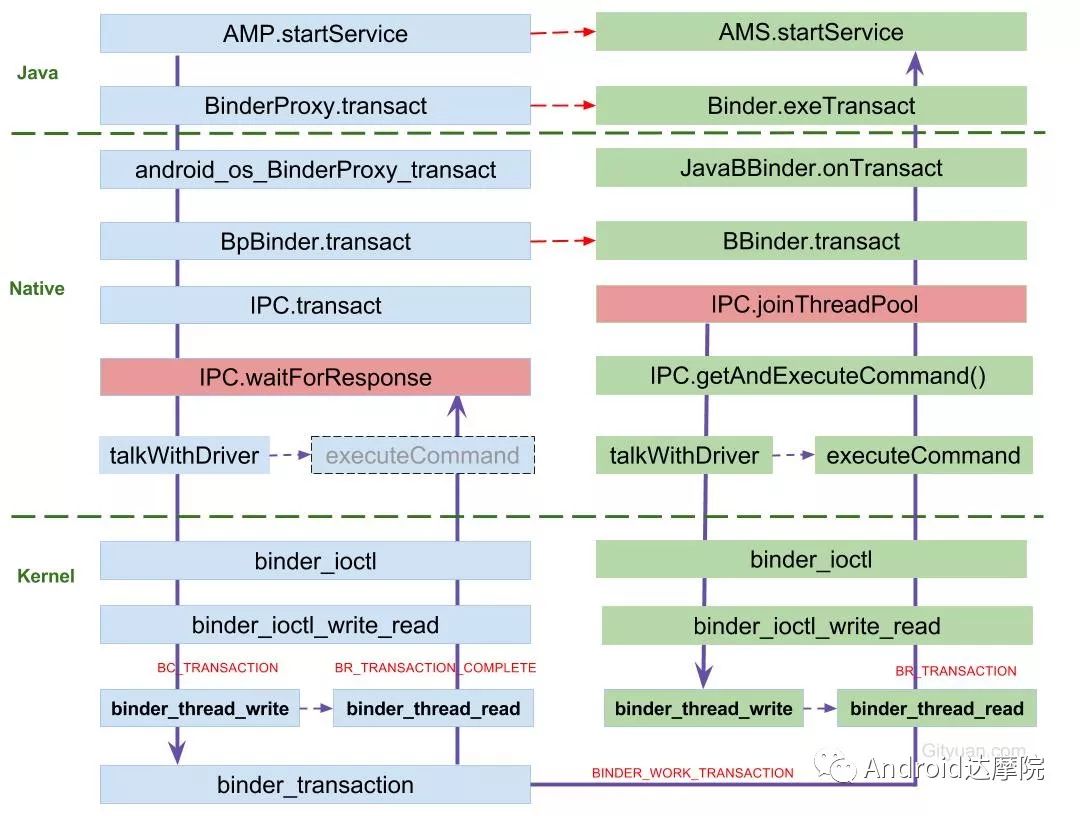
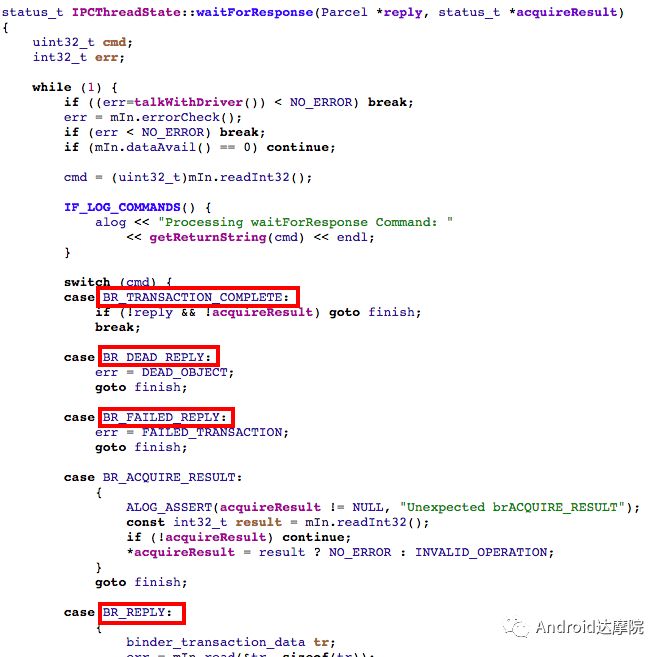
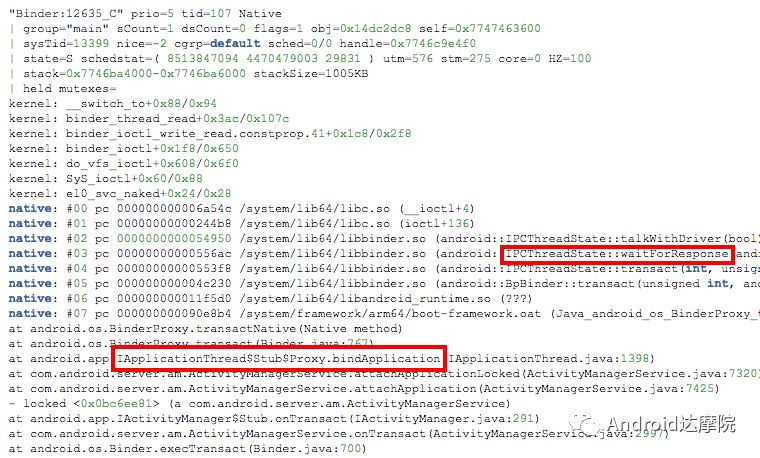
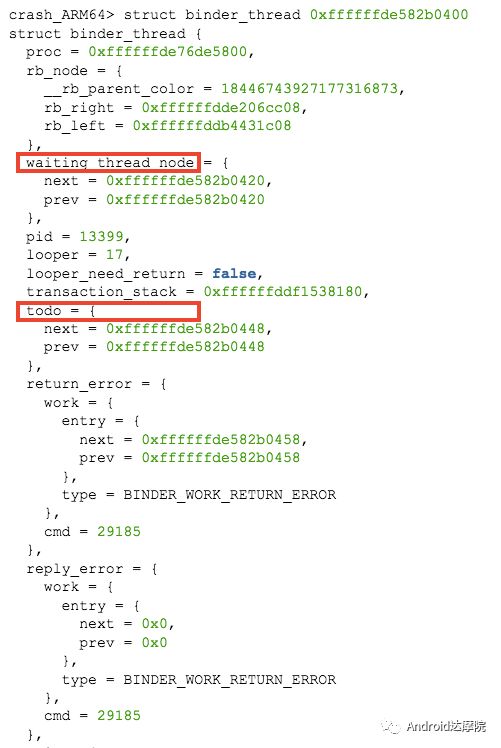
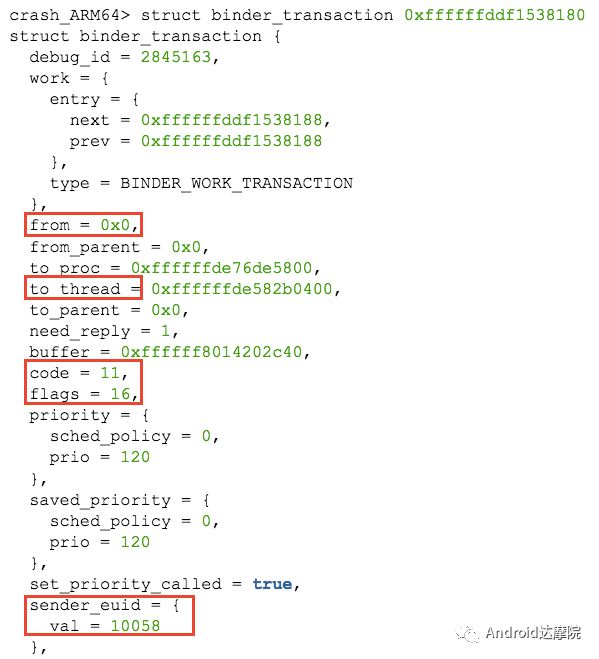
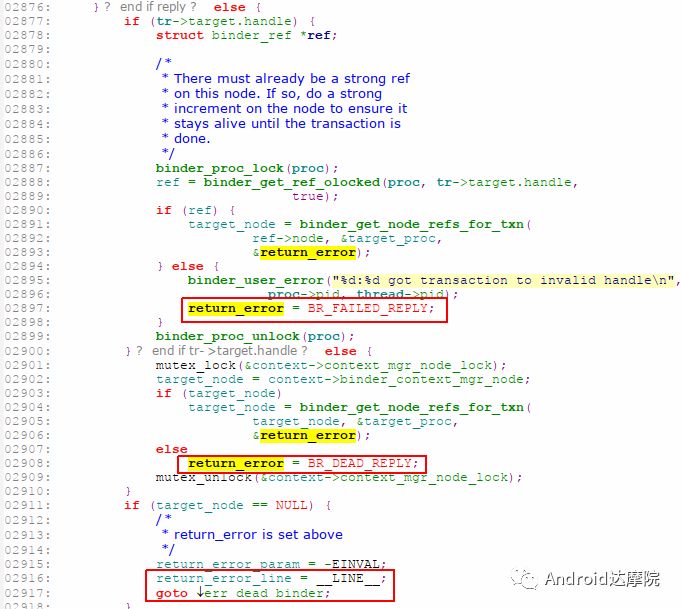
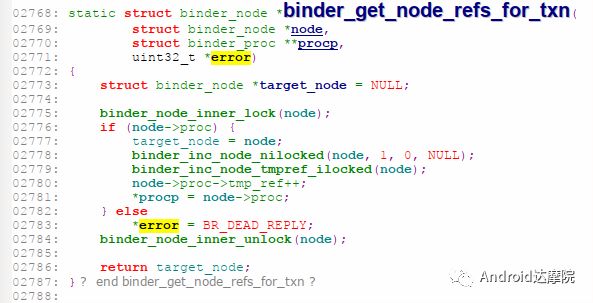
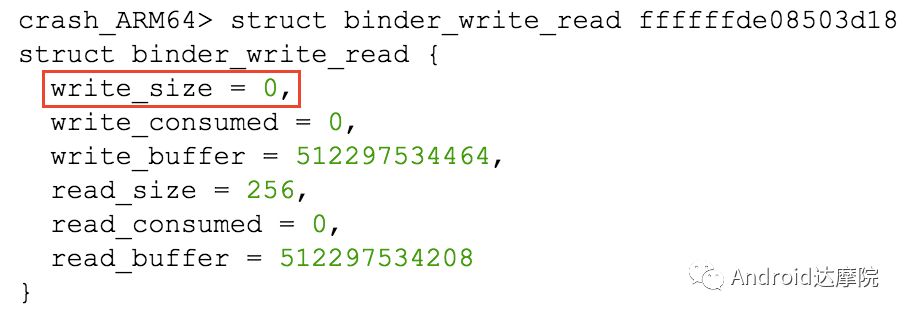
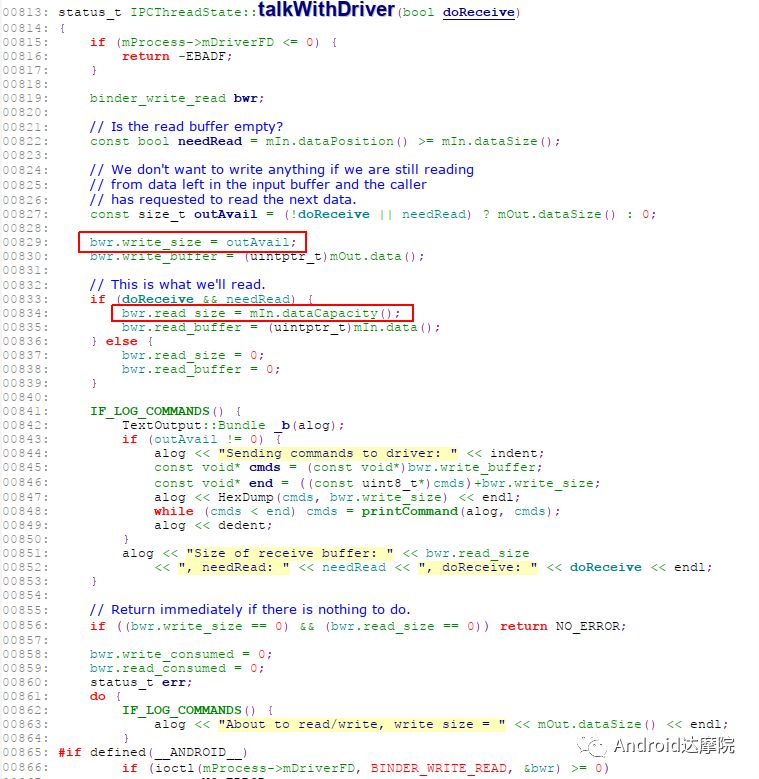
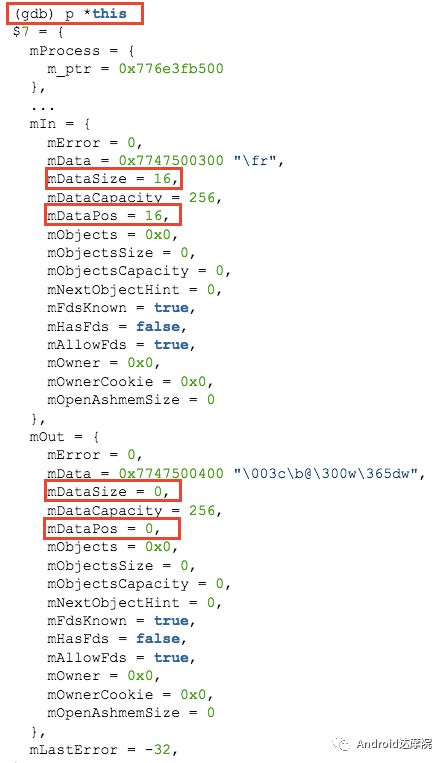
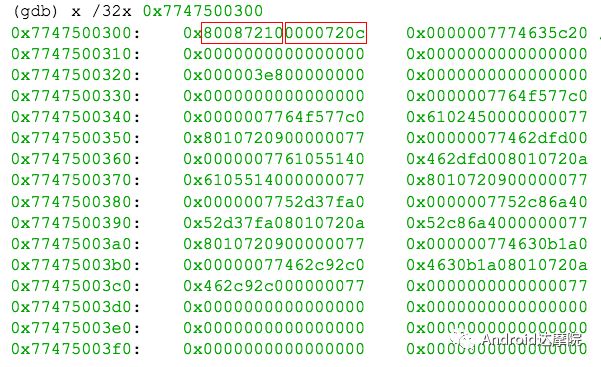
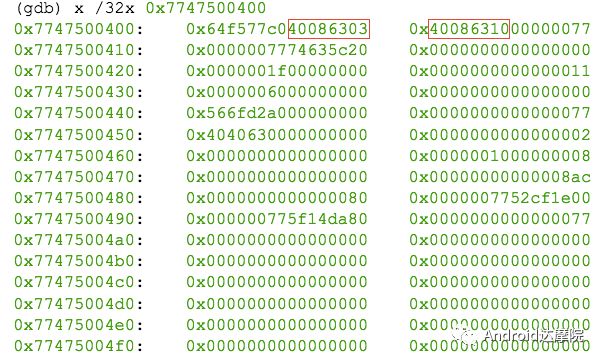
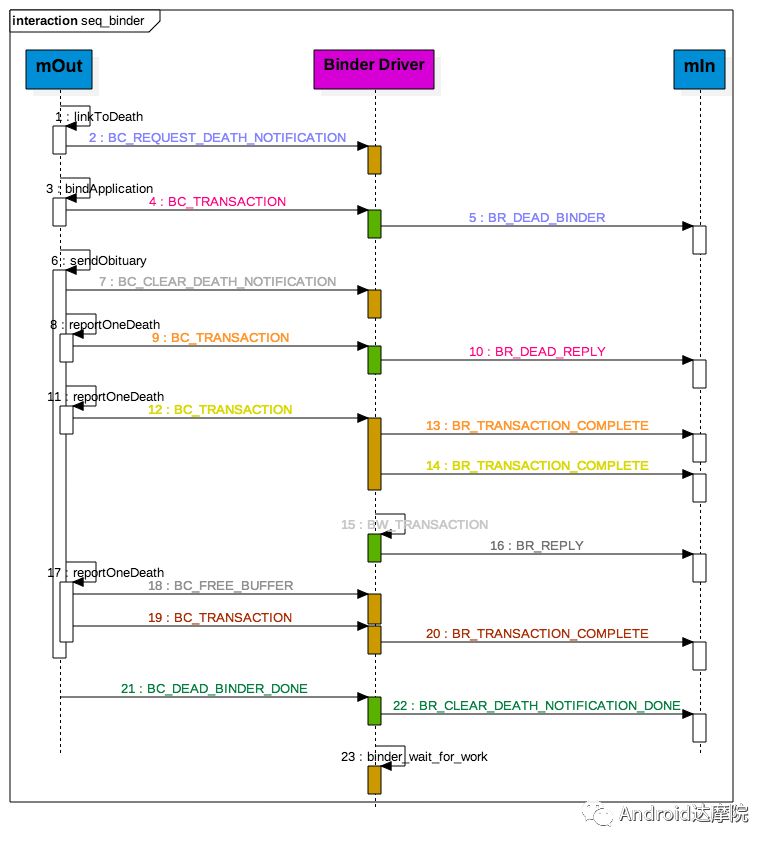
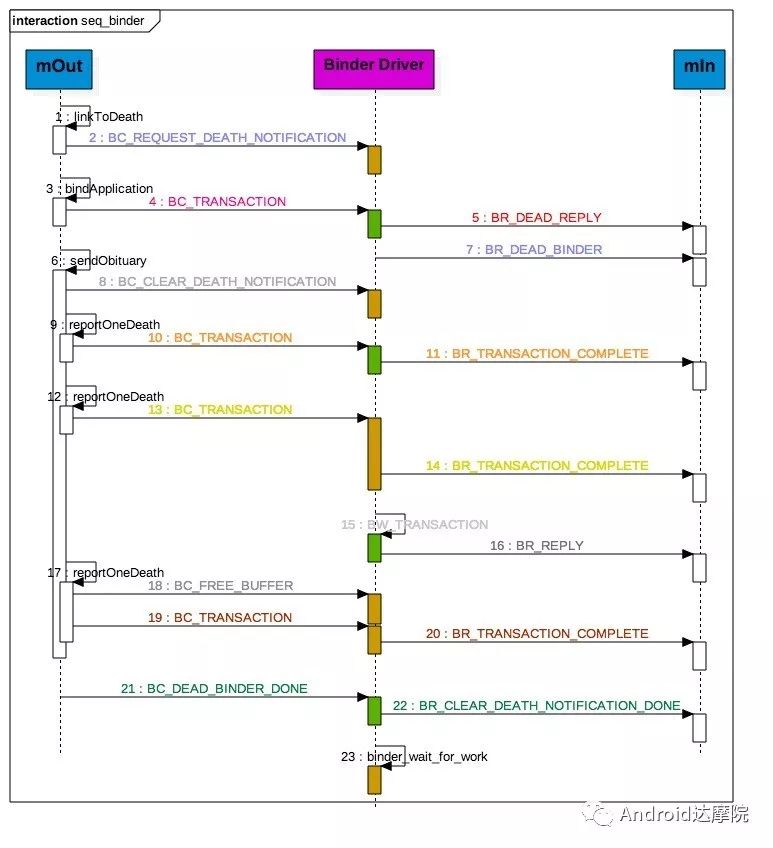
introduction This article explains how the asynchronous binder call blocks the entire system and uses ramdump information and the binder communication protocol to deduce and restore the fixed screen scene. First, background knowledge The basic knowledge points involved in solving this problem include: Trace, CPU scheduling, Ramdump derivation, Crash tool, GDB tool, and Ftrace. In particular, the in-depth understanding of the binder IPC mechanism. 1.1 Tool Introduction Trace: The most basic skills for analyzing deadlock problems. The corresponding traces.txt file can be generated by kill -3, which records the current call stack of each thread in the system. CPU scheduling: You can check whether the thread is waiting in the RQ queue for a long time by checking the schedstat node. Ramdump: A memory crash file that stores data at a certain point in the memory of the system and is in the ELF file format. When a fatal error in the system cannot be recovered, the active trigger grab ramdump can remain on the scene. This is an advanced debugging recipe. Crash tool: used to derive and analyze ramdump memory information. GDB tools: powerful command-line debugging tools released by the GNU open source organization under the UNIX/LINUX operating system, for analyzing coredumps, for example Ftrace: A powerful tool for analyzing the runtime behavior of the Linux kernel, such as the time-consuming data of a method and the execution flow of code. 1.2 Introduction to Binder Binder IPC is the cornerstone of cross-process communications for the entire Android system. The vast majority of cross-processes in the entire system use Binder. If you don't know much about Binder, it can be very difficult to read this article. There are a lot of tutorials on the Binder principle in the Gityuan.com blog. The article, see http://gityuan.com/2015/10/31/binder-prepare/, will not repeat them here. Simply lists two diagrams of the Binder communication architecture. Binder communication adopts C/S framework, mainly including Client, Server, ServiceManager and binder driver. ServiceManager is used to manage various services in the system. The dashed line drawn by the Client to Server communication process diagram is because they do not directly interact with each other, but use the ioctl way to interact with the Binder driver so as to realize the IPC communication mode. Next, take startService as an example to show the method execution flow of a Binder communication process: From the figure, it can be seen that when a binder call is initiated, it stops at the waitForResponse() method and waits for the specific work to finish. So when does the binder call end exit the waitForResponse() method? See below: Exit waitForResponse scene description: 1) When the client receives BR_DEAD_REPLY or BR_FAILED_REPLY (usually the peer process is killed or the transaction fails), the synchronous or asynchronous binder call ends the waitForResponse() method. 2) In the case of normal communication, when the BR_TRANSACTION_COMPLETE is received, the synchronous binder call ends; when the BR_REPLY is received, the asynchronous binder call is ended. Second, preliminary analysis With the above background knowledge, the next step is to enter into the actual combat analysis process. 2.1 Problem Description The Android 8.0 system has the probability of setting screen problems with dozens of mobile phones running dozens of hours of monkeys in a row. Fixed screen refers to the screen stuck for a long time, can also become a frozen screen or hang machine, in most cases is due to a direct or indirect deadlock between multiple threads, and this case is very rare For example, the asynchronous method is blocked in an infinite wait state, resulting in a fixed screen. 2.2 Preliminary analysis By looking at the trace, it is not difficult to find the cause of the fixed screen is as follows: All binder threads of the system_server and important scenes are waiting for the AMS lock. The AMS lock is held by the thread Binder: 12635_C. Binder: The 12635_C thread is executing the bindApplication() method. The call stack is as follows: The ultimate problem: attachApplicationLocked() is an asynchronous binder call. It's called an asynchronous binder call because it can be executed asynchronously without blocking threads. But here it is able to block the entire system, which is basically a place of destruction. Doubt 1: Some students may feel that it is not a sleeping wake-up problem in the Binder driver. An exception occurs in the peer process, which prevents it from waking up the binder thread and blocking the system. Answer 1: This view at first glance seems reasonable and reasonable. Next, I'll come to science to see. If you are familiar with the Binder principle, you should know that the above is impossible. Oneway Binder Call, also called Asynchronous Call, Binder mechanism design can't be stupid enough to allow asynchronous binder call to wait for the peer process to wake up. The true oneway binder call, once sent out by the transaction. a) If it succeeds, it will put BINDER_WORK_TRANSACTION_COMPLETE inside its thread's thread->todo queue; b) If it fails, it will put BINDER_WORK_RETURN_ERROR inside its thread's thread->todo queue. Immediately after, it will read out the BINDER_WORK_XXX in the binder_thread_read() procedure, and then call the binder call. The reason is to put BINDER_WORK_XXX into its own queue, in order to tell whether this transaction was successfully delivered to the peer process. However, the entire process does not require the participation of peer processes. In other words, the bindApplication() method acts as an asynchronous binder call method and only waits for BR_TRANSACTION_COMPLETE or BR_DEAD_REPLY or BR_FAILED_REPLY written to its own todo queue. Therefore, the argument that the peer process cannot be awakened is absolutely impossible to guess. Doubt 2: CPU's priority reversal problem, the current Binder thread is in low priority, can not allocate CPU resources and block the system? Answer 2: From the bugreport, analyze the cpu scheduling of blocked threads in the fixed screen process. Before explaining it first, first add a bit about CPU interpretation skills: The smaller the nice value, the higher the priority. Here nice=-2, visible priority is still relatively high; The three numbers in parentheses in schedstat are Running, Runable, and Switch, followed by utm and stm. Running time: CPU running time, unit ns Runable time: waiting time of RQ queue, unit ns Switch times: CPU scheduling switching times Utm: The time when the thread is executed in user mode, the unit is jiffies, jiffies is defined as sysconf(_SC_CLK_TCK), and the default is equal to 10ms. Stm: the time when the thread was executed in kernel mode. The unit is jiffies. The default is equal to 10ms. Visible, the thread Running=186667489018ns, also about equal to 186667ms. The CPU runtime includes user mode (utm) and kernel mode (stm). Utm + stm = (12112 + 6554) × 10 ms = 186666 ms. Conclusion: utm + stm = first parameter value of schedstat. With the above basic knowledge, let's look at the bugreport. Since the system is hanged, the watchdog will output the call stacks one after the other. Let's take a look at the schedstat data for each call, as follows: It can be seen that there is no change in the Runable time, which means that the thread is not in the CPU waiting queue and cannot get CPU scheduling. At the same time, the Running time is hardly moving. Therefore, the thread is in a non-Runable state for a long time, thus excluding the CPU priority reversal problem. Look at Event Log again Doubt: The appDiedLock() method is usually executed with the BinderDied death callback, but the death callback must be located in another thread. Since the binder thread is busy, there is no time to process it. Why is the same thread executing the attachApplication() process and executing the appDiedLock() method without ending? Observe a number of fixed EventLogs. At the last moment, attachApplication() is executed before appDiedLock() is executed. Here is suspected with the killing process or in a Binder nested call case, the two things in the binder thread? These are just suspicions. They are probabilistic problems themselves. They need more in-depth analysis to answer these questions. Three, ramdump analysis There is too little effective information, basically no further analysis can be used, only by grabbing ramdump hopefully through the cracks inside to launch the entire process. The grabbed ramdump is just the last moment after the triggering of the screen. This is like the final scene of the crime scene. We can't know what the motivation of the crime is, and we can't know what happened in the middle. Based on the static picture of ramdump, to deduct the whole process of committing a crime, it needs a powerful deduction ability. First analyze the ramdump information and find as much effective information as possible. 3.1 Structure binder_thread Find the method binder_ioctl_write_read() on the call stack of the blocked thread from the ramdump. The fourth parameter of the method points to the binder_read structure. Use the crash tool to further find the structure of binder_thread as follows: Interpretation: Waiting_thread_node is empty, then the thread→transaction_stack of the binder thread is not empty or thread→todo is not empty; Todo is empty, combined with the previous waiting_thread_node, then the thread→transaction_stack must not be empty; The cmd of return_error and reply_error is equal to 29185, converted to hexadecimal equal to 0x7201, and the command represented is BR_OK = _IO('r', 1), indicating that the final state of the binder thread has no error, or an error occurred in the middle and has been consumed Drop off Looper = 17, indicating that the thread is in the wait state BINDER_LOOPER_STATE_WAITING 3.2 binder_transaction structure Since thread→transaction_stack is not empty, the binder_transaction structure is resolved according to the transaction_stack = 0xffffffddf1538180 of the binder_thread structure: Interpretation: From = 0x0, indicating that the originating process is dead Sender_euid=10058, Here is the process that was killed by the one-click cleanup in the event log. Here you can feel that this exception is related to killing the process. The to_thread points to the current system_server's binder thread, indicating that this is a request from the remote process to the process. Flags = 16, Description is synchronous binder call Code = 11, indicating that the call attachApplication (), although it can not be determined here, but from the context and the previous stack, basically can think so, follow-up will demonstrate. Here, think of the information under the binder interface, take a look at the code=b that is consistent with the previous, it should also be attachApplication (), as follows: Thread 13399: l 11 need_return 0 tr 0 incoming transaction 2845163: ffffffddf1538180 from 0:0 to 12635:13399 code b flags 10 pri 0:120 r1 node 466186 size 92:8 data ffffff8014202c98 3.3 Special 2916 Looking at the kernel Log, the binder thread that was hung has a Binder communication failure message: Binder : release 6686:6686 transaction 2845163 out, still active binder : 12635:13399 transaction failed 29189/-22, size 3812-24 line 2916 29189=0x7205 stands for BR_DEAD_REPLY = _IO('r', 5), which means return_error = BR_DEAD_REPLY, and the error line is 2916. What code will go to 2916 in the scenario? Look at the Binder Driver code: According to return_error=BR_DEAD_REPLY, looking back from 2916, the speculative code should go to 2908 lines of code; push up to illustrate target_node = context → binder_context_mgr_node. This target_node refers to the binder_node of the service_manager process. Then binder_context_mgr_node is empty scene, only trigger servicemanger process is dead, or at least restarted; but by looking at the servicemanger process does not die and restart; itself goes to 2900 lines, tr-> target.handle is equal to empty, in this context it is difficult Explained, this point of view is even more contradictory. At this point, one has to suspect that there are flaws in the reasoning, and even doubt the log output mechanism. After repeated verification, it was found that the 2893 line binder_get_node_refs_for_txn() was originally ignored. The code is as follows: Everything is suddenly clear, because the peer process is killed, then note → proc = = null, thus having return_error = BR_DEAD_REPLY. 3.4 binder_write_read structure After observing the blocked binder thread and transaction structure, you need to look at the data. The third parameter of the binder_ioctl_write_read() method on the call stack points to the binder_write_read structure. After being resolved with the crash tool, the following information is obtained: Interpretation: Write_size=0, looks a little special, this communication process does not need to write data to the Binder Driver, regular transaction have commands to write Binder Driver; Read_size=256, this communication process needs to read data; So what scenario, write_size is equal to 0, and read_size is not equal to 0? Need to see the core method talkWithDriver() of the user space interaction with kernel space Binder Driver, the code is as follows: From the above code we can see: read_size is not equal to 0, then doReceive = true, needRead = true, so that mIn is equal to empty; plus write_size = 0 mOut is empty. In other words, when the blocked thread interacts with the Binder driver for the last time, both mIn and mOut are null. The current thread is stuck in the attachApplicationLocked() process. The process of executing this method must write data to mOut. However, from the last scene after the incident, the data in mOut was empty. This is a violation of the conventional practice. The first one may be skeptical that memory stamping has occurred, but each time it happened to be able to It is not possible to step on this data alone. For further verification, take out the data for the two buffers, mOut and mIn. 3.5 mOut && mIn When the IPCThreadState structure is initialized, set the size of mOut and mIn to 256 respectively. Binder IPC process is to use mOut and mIn to bear the function of writing data to Binder driver and reading data from Binder driver. Although old commands may be overwritten during repeated use, there may still be some useful information. mOut and mIn are user space data and are member variables of the IPCThreadState object. The program stops in the user space in the waitForResponse() process of IPCThreadState. Using GDB prints out all the members of this pointer in the current thread user space, and then finds mOut and mIn. Interpretation: mIn buffer, mDataSize = 16, mDataPos = 16, shows that the last talkWithDriver generated two BR commands and has been processed; mOut buffer, mDataSize = 0, mDataPos = 0, indicating that BC_XXX has been consumed Let's take a closer look at the data in the two buffers. From the figure above, it can be seen that the mData addresses of mIn and mOut are 0x7747500300 and 0x7747500400 respectively, and the size of the buffer area is equal to 256 bytes; the mIn buffer stores all the BR_XXX commands (0x72). ; mOut buffer is stored in the BC_XXX command (0x63). Let's look at the data in the two caches separately: mIn buffer data: Interpretation: BR_NOOP = 0x720c, BR_CLEAR_DEATH_NOTIFICATION_DONE = 0x7210, we can see that the process of the last talkWithDriver in the mIn data area produced two BR commands in order: BR_NOOP, BR_CLEAR_DEATH_NOTIFICATION_DONE mOut cache data: Interpretation: BC_FREE_BUFFER = 0x6303, BC_DEAD_BINDER_DONE = 0x6310, we can see the mOut data area last talkWithDriver process, the BC commands consumed are: BC_FREE_BUFFER, BC_DEAD_BINDER_DONE The contents of the mOut and mIn data areas in the two ramdumps are basically the same, and the BC and BR information in the buffer area are exactly the same. Through the ramdump deduction, the todo queue of the blocked thread is actually empty. The last transaction that was processed is BC_FREE_BUFFER, BC_DEAD_BINDER_DONE, BR_NOOP, and BR_CLEAR_DEATH_NOTIFICATION_DONE. It can be interpreted that there are only so many related threads in this case. 3.6 difficult cases Solving the difficult problems of the system may be no less than the detection of cases, and this case is like a murder case in the closet. The first time after the incident to investigate the site (grabbing ramdump), from the door and the window are locked inside (mIn cache write_size equal to 0), the murderer is how to escape the scene after the crime (todo queue is empty )? The sword wound from the body of the victim (blocked thread) is not fatal (the asynchronous thread will not be blocked). What is the cause of death? Judging from the various signs on the scene (ramdump derivation), it is very likely that this is not the first case (BUG is not found in the current binder transaction process), most likely the murderer commits crimes (other transactions) in it, and then move the body To the current crime scene (binder returned to the previous call after nesting), then where is the real first crime scene? Eighteen martial arts such as Trace, Log, Ramdump derivation, Crash tool, and GDB tool have all been used. There is no more information to dig out. This problem is almost a headless case. Fourth, the truth 4.1 Case Detection The case is not broken in a day, like a squatting squawk, stumbling over food. In the brain's repeated playback of the scene around the scene, there is a very serious doubt that comes into mind. One of the objects (BC_DEAD_BINDER_DONE agreement) should normally be in the other room (binder's death and suicide related), but why it appears in the crime scene (bindApplication) The waitForResponse process)? Based on the final scene, follow this clue through reverse reasoning analysis to try to deduce the murderer's entire crime process. But for such a complicated case (binder communication system has a lot of events happening every moment, the conversion between protocols is also more complicated). This reverse reasoning process is very complicated. Through continuous reverse and forward combination analysis, there are N possibilities for each layer to push back backwards. Excluding as many branches as possible can be as many as possible. Keep the possible branches and continue to push back. The most brain-burning and time-consuming in the entire deduction process, see the cover photo has a lot of reasoning process. In the end, the first case was discovered miraculously, and the method of reproduction was found. In order to save space, 10,000 words were omitted here. To come up with the conclusions directly, the real first case was discovered as follows: Immediately after the process was started, killing it before executing the linkToDeath() method would recreate the screen: 4.2 Interpretation of the case file The complexity of this problem is that even if the first case of discovery and the path of reproduction are found, it is more complicated to completely understand the process of each protocol conversion in the middle. Open the binder driver's ftrace information with the following command to output each binder communication protocol and data. The entire binder communication will continue to switch between user space and kernel space. The flow of data in the Binder IPC communication process shows: (BINDER_WORK_XXX referred to as BW_XXX) mOut: Record User Space Write Commands to Binder Driver The BC command is consumed through the binder_thread_write() and binder_transaction() methods, and the corresponding BW_XXX command is generated, and the BW command may not be generated. The thread_thread_write() procedure is not executed when thread->return_error.cmd != BR_OK Thread→todo: BINDER_WORK record waiting for the current binder thread needs to be processed BW commands are consumed through the binder_thread_read() method and the corresponding BR_XX commands are produced, and BR commands may not be generated In general, if there is no BC_TRANSACION or BC_REPLY, then do not read; BW_DEAD_BINDER exception; mIn: Command to Record Binder Driver Transfer to User Space Consume BR commands with the waitForResponse() and executeCommand() methods In addition, regarding talkWithDriver, when mIn has data, it means there is no need to read data from the binder driver. Reason: needRead = 0, read_buffer size is set to 0, when doReceive = true, write_buffer size is also set to 0. This will not interact with the driver. The detailed process of the incident process: Process interpretation: (9 talkWithDriver occurred throughout the process) The thread executes linkToDeath() and writes BW_DEAD_BINDER to the Binder Driver's thread todo queue in a flush-only, write-unreadable manner. Execute bindApplication(), because the target process is dead, write BW_RETURN_ERROR to the todo queue, this time return_error.cmd = BR_DEAD_REPLY; Kernel space, convert BW_DEAD_BINDER to BR_DEAD_BINDER, synchronously place BW_DEAD_BINDER into proc->delivered_death; Back to user space , execute sendObituary(), which is still in waitForResponse() of bindApplication(). Add BC_CLEAR_DEATH_NOTIFICATION to mOut, use flush, add return_error.cmd = BR_DEAD_REPLY, and do not write or read this time. Execute the first reportOneDeath(). At this time, return_error.cmd = BR_DEAD_REPLY is not written, remove BW_RETURN_ERROR, and set return_error.cmd=BR_OK; returning to user space, terminating the first reportOneDeath(), incorrectly consuming bindApplication( BR_DEAD_REPLY generated. Executing the second reportOneDeath() consumes the BR_TRANSACTION_COMPLETE protocol generated by the first and second reportOneDeath. Since the second reportOneDeath is the synchronous binder call, it still needs to wait for the BR_REPLY protocol. At this point mOut and mIn are empty, enter the kernel binder_wait_for_work (), wait for the target process to initiate the BC_REPLY command, into the current thread todo queue BW_TRANSACTION; received BW_TRANSACTION protocol is converted to BR_REPLY, complete the second reportOneDeath (). Perform a third reportOneDeath(), and after receiving BR_TRANSACTION_COMPLETE, complete the second reportOneDeath(). To complete execution of sendObituary() completely, the BC_DEAD_BINDER_DONE protocol needs to be added to mOut. After receiving the protocol, the driver adjusts BW_DEAD_BINDER_AND_CLEAR of proc→delivered_death to BW_CLEAR_DEATH_NOTIFICATION, and puts it into the thread->todo queue; then BR_CLEAR_DEATH_NOTIFICATION_DONE is generated to complete the process. Communication; Back to bindApplication()'s waitForResponse, when both mOut and mIn are empty, enter the kernel binder_wait_for_work(). The thread will no longer receive other transactions, nor will it be able to generate transactions and will be stuck forever. In all, the causes of asynchronous binder call blocking are as follows: The first asynchronous reportOneDeath() consumes the BW_RETURN_ERROR generated by bindApplication(); The second synchronization reportOneDeath() consumes the remaining BR_TRANSACTION_COMPLETE of the first asynchronous reportOneDeath() itself; The BW_RETURN_ERROR generated by bindApplication() has been spent endlessly waiting due to being consumed by others. 4.3 Summary The real analysis is far more complicated than this. Given the space, the article only explains one of the scenarios. Different Binder Drivers and different Framework code combinations have several different performance and processing flows. However, the most fundamental problem is that in the nested binder communication process, BR_DEAD_REPLY is incorrectly consumed by other communication and thus caused an exception. My solution is that when the transaction error occurs, the BW_RETURN_ERROR transaction is put into the head of the current thread's todo queue, and the BW_RETURN_ERROR transaction generated by itself is guaranteed to be consumed by itself. This solves the problem of asynchronous binder communication in a nested scenario. The infinite blocking problem, the optimized processing flow chart: Of course, there is a second solution is to avoid all binders nested as possible, Google in the latest binder driver driver uses BW_DEAD_BINDER into the proc todo queue to avoid nesting problems, this program itself can also, but I think in Whether the execution process has BW_RETURN_ERROR or should be put in the head of the queue, and deal with the error at the first time, so as to avoid the BUG that is consumed by mistake. In addition, if the binder adds other logic, it may cause nesting to appear. There is a similar problem. Recently, this problem has been circulated several times with Google engineers, but they still want to maintain the logic of adding transactions to the tail of the thread todo queue at a time. For nested problems, we hope to solve this problem by putting it into the proc todo queue. In this regard, worry about the follow-up scalability will be ignored or forgotten, but also lead to binder nesting problems, Google engineers said that adding new features in the future will also eliminate the emergence of nested logic to keep the logic and code simplicity. Finally, this room murder is indeed committed in it (reportOneDeath consumed BW_RETURN_ERROR generated by bindApplication), and then move to the current crime scene (return to the bindApplication's waitForRespone method after executing BR_DEAD_BINDER), resulting in asynchronous Binder call Can also be blocked.
53 Jack.We are manufacturer of 6p6c Female Connector in China, if you want to buy RJ11 Jack Full Plastic MINI,6 Pin RJ11 Modular Connector,RJ11 Jack Full Shielded please contact us.
The RJ-45 interface can be used to connect the RJ-45 connector. It is suitable for the network constructed by twisted pair. This port is the most common port, which is generally provided by Ethernet hub. The number of hubs we usually talk about is the number of RJ-45 ports. The RJ-45 port of the hub can be directly connected to terminal devices such as computers and network printers, and can also be connected with other hub equipment and routers such as switches and hubs.
6p6c Female Connector,RJ11 Jack Full Plastic MINI,6 Pin RJ11 Modular Connector,RJ11 Jack Full Shielded ShenZhen Antenk Electronics Co,Ltd , https://www.antenk.com